Is it possible to visualize a jazz musician’s musical style?
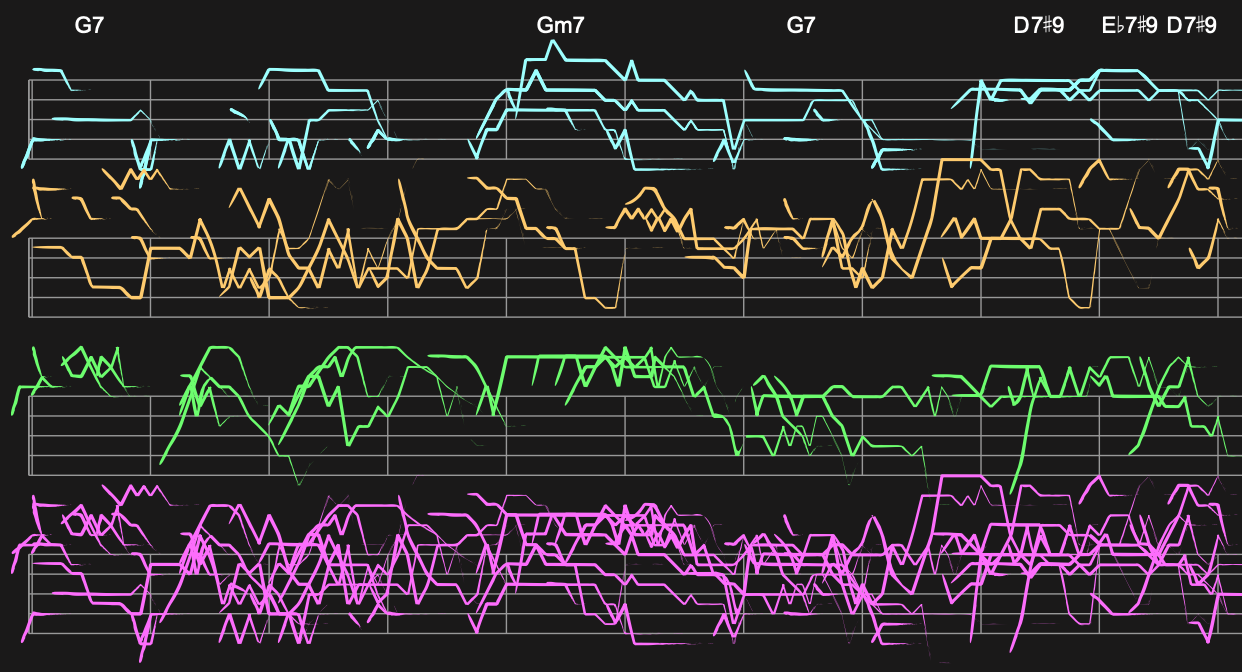
When I was at UC Berkeley finishing my Masters, I came up with a novel device for visualizing jazz improvisation based on simple musical notation. I envisioned a future where students could learn to improvise using an AI-assisted practice agent who would coach them on improvising by highlighting patterns in their solos. It could also portray a musician’s particular style regarding musical phrasing and harmonic choices.
I chose the song All Blues from arguably the most famous jazz recordings of all time, Kind of Blue by Miles Davis from 1959. It features solos from Miles Davis, Cannonball Adderly, and John Coltrane, forming the visualization’s primary subject matter. The recording was done in one take, and none of the musicians even had a chance to see the music before playing it that day for the first time.
When I finished graphing the solos, I was surprised to see strong patterns that differed for each musician in their phrasing and harmonics.
Marti Hearst, my mentor at UC Berkeley’s School of Information, encouraged me to write a paper and submit it to the Computer-Human-Ineraction Society (CHI). With her assistance, we co-authored a paper accepted for publication in the official proceedings of CHI 2005. I designed and presented a poster at the CHI 2005 conference in Portland, Oregon.
